Category: Blog

Technical guides and best practices

  • Green 5G: Power Efficiency Optimization Strategies for Always-On FWA CPE in Large-Scale Operator Deployments

    Green 5G: Power Efficiency Optimization Strategies for Always-On FWA CPE in Large-Scale Operator Deployments

    As 5G Fixed Wireless Access (FWA) deployments scale into the tens of millions of units globally, the aggregate power consumption of always-on CPE devices has emerged as a significant operational and environmental concern for operators. A fleet of one million 5G CPE devices, each consuming an average of 12 watts continuously, draws approximately 105 GWh annually — equivalent to the electricity consumption of roughly 10,000 average households. For operators with sustainability commitments and cost-sensitive deployment economics, power efficiency is no longer a secondary specification; it is a strategic procurement criterion.

    The Power Consumption Profile of 5G FWA CPE

    A typical 5G FWA CPE draws power across four primary subsystems: the 5G modem/RF front-end (40-50% of total), the Wi-Fi access point and Ethernet switch (20-25%), the applications processor and memory (15-20%), and ancillary components including power regulation, thermal management, and LED indicators (10-15%). Understanding this breakdown is essential for identifying the highest-return optimization targets.

    Indoor 5G CPE devices typically operate in the 8-15W range under load, while outdoor units with higher-gain antenna arrays and Power over Ethernet (PoE) interfaces can draw 15-30W. The key challenge for power optimization is that FWA CPE devices, unlike smartphones, must remain in an always-connected, always-available state — aggressive sleep states that increase latency or delay push notification delivery are unacceptable for carrier-grade service level agreements.

    Chipset-Level Optimization: The Foundation of Efficiency

    The most impactful power efficiency gains originate at the chipset level. Modern 5G modem platforms from Qualcomm (Snapdragon X75/X80), MediaTek (T830), and UNISOC (V510) incorporate sophisticated power management frameworks that dynamically adjust voltage and clock frequency based on real-time traffic demands. These frameworks, often referred to as Dynamic Voltage and Frequency Scaling (DVFS), can reduce modem subsystem power draw by 25-35% during periods of low to moderate traffic without compromising connection quality.

    Equally important is the transition to advanced semiconductor process nodes. 5G CPE chipsets manufactured on 4nm and 6nm processes demonstrate approximately 20-30% lower power consumption compared to equivalent 7nm designs, while 3nm processes — expected in CPE chipsets by late 2026 — promise another 15-20% reduction. For operators planning multi-year procurement programs, specifying minimum process node requirements can lock in significant cumulative power savings across the deployed fleet.

    Intelligent Sleep States and Connected-Mode DRX

    5G NR introduces Connected-Mode Discontinuous Reception (C-DRX), a protocol-level power-saving mechanism that allows the CPE modem to periodically enter a low-power state between data transmissions while maintaining RRC Connected status. Properly configured C-DRX cycles — typically 40-160 ms for FWA applications — can reduce modem power consumption by 15-25% without introducing perceptible latency for most enterprise workloads.

    Beyond C-DRX, advanced CPE platforms are beginning to implement application-aware sleep state management. By integrating with the device’s deep packet inspection (DPI) engine, the power management controller can identify traffic patterns — VoIP calls, bulk file transfers, idle periods — and dynamically transition between power states with granularity far exceeding what static timer-based approaches can achieve. A CPE serving a small office that operates 9 AM to 6 PM, for example, can automatically transition to a deep low-power state during overnight hours, reducing 24-hour average power consumption by 20-30%.

    Dynamic Bandwidth Scaling and Carrier Aggregation Optimization

    5G FWA CPE devices often operate with carrier aggregation (CA) configurations that combine multiple component carriers (CCs) to achieve peak throughput. However, each active CC requires additional RF chains and baseband processing, directly increasing power consumption. A CPE aggregating four 100 MHz carriers draws significantly more power than one operating on a single carrier, even when actual throughput demands do not require the additional capacity.

    Intelligent carrier aggregation management dynamically activates and deactivates secondary component carriers based on real-time throughput requirements. During periods of light usage — email, web browsing, IoT telemetry — the CPE operates on a single primary carrier, consuming baseline power. When a large file transfer or video conference begins, secondary carriers are activated within milliseconds to deliver the required throughput, then deactivated when demand subsides. Field measurements indicate this approach can reduce average power consumption by 12-18% compared to always-on multi-carrier configurations.

    Renewable Energy Integration for Outdoor CPE

    For outdoor 5G FWA CPE deployed in rooftop, tower, or pole-mounted configurations — particularly in rural and remote areas — integrating solar power with battery backup presents a compelling path toward net-zero energy operation. Modern outdoor CPE platforms are being designed with native DC input ranges (12-48V) compatible with solar charge controllers, eliminating the efficiency losses associated with DC-to-AC-to-DC conversion in traditional setups.

    A typical outdoor CPE consuming 20W can be sustainably powered by a 100W solar panel paired with a 500Wh lithium iron phosphate (LiFePO4) battery, providing 24-hour autonomous operation with 2-3 days of battery reserve for cloudy conditions. For operators deploying thousands of outdoor CPE units in off-grid or unreliable-grid locations, solar integration not only reduces operational electricity costs but also improves service reliability by eliminating grid dependency as a single point of failure.

    Procurement Guidelines for Power-Efficient CPE

    For B2B buyers and operator procurement teams, the following specifications should be incorporated into CPE RFPs to ensure power efficiency is systematically addressed:

    • Chipset Process Node: Require 6nm or better; preference for 4nm platforms with roadmap to 3nm
    • Idle Power Consumption: Maximum 4W in connected idle state (C-DRX active, Wi-Fi broadcast enabled)
    • Dynamic Power Scaling: Demonstrate at least 40% power reduction between peak throughput and idle states
    • C-DRX Support: 3GPP Release 16+ C-DRX with configurable cycle lengths and application-aware management
    • Intelligent CA Management: Support for dynamic secondary carrier activation/deactivation with sub-50ms transition latency
    • DC Power Input: Native 12-48V DC input range for solar/battery integration in outdoor units
    • Power Monitoring Telemetry: Per-subsystem power consumption reporting via TR-369 USP for fleet-level efficiency analytics
    • Operating Temperature: Full performance at -20 deg C to +55 deg C without active cooling (passive thermal design)

    Environmental and Business Impact

    The cumulative impact of power-efficient CPE design at scale is substantial. For an operator deploying 500,000 FWA CPE devices, a 30% reduction in per-unit power consumption translates to approximately 15.8 GWh of annual energy savings — equivalent to roughly 11,000 metric tons of CO2 emissions reduction based on the global average grid carbon intensity. At an average commercial electricity rate of 0.12 USD per kWh, the annual operational cost savings approach 1.9 million USD.

    Beyond direct cost and carbon savings, power-efficient CPE enhances the operator’s sustainability reporting credentials, supports compliance with emerging energy efficiency regulations (such as the EU Code of Conduct for Broadband Equipment), and reduces the thermal management burden in dense deployment scenarios where multiple CPE devices operate in confined spaces such as MDU telecom closets.

    Honlly Telecom integrates advanced power management technologies across its 5G FWA CPE portfolio, including 4nm chipset platforms, intelligent C-DRX management, dynamic carrier aggregation optimization, and solar-ready outdoor designs. Contact our product engineering team for detailed power consumption test reports and efficiency benchmarks.


  • 5G CPE Antenna Configuration for B2B Deployments: 2×2 MIMO vs 4×4 MIMO vs External Antenna — A 2026 Selection Guide for ISP and Enterprise Projects

    5G CPE Antenna Configuration for B2B Deployments: 2×2 MIMO vs 4×4 MIMO vs External Antenna — A 2026 Selection Guide for ISP and Enterprise Projects

    Antenna configuration is the single most consequential — and frequently overlooked — variable in 5G FWA CPE performance. A CPE device with the wrong antenna setup can deliver 50–70% less throughput than an optimally configured unit, even when connected to the same 5G NR cell. For B2B buyers — ISPs deploying at scale, enterprises building branch networks, system integrators designing connectivity solutions — understanding the trade-offs between 2×2 MIMO, 4×4 MIMO, and external antenna configurations is essential to achieving target SLAs and controlling deployment costs.

    This guide provides procurement teams and network engineers with a practical framework for antenna selection, covering the technical fundamentals, measured performance differences, cost implications, and deployment-specific recommendations for 2026.

    MIMO Fundamentals: Why Antenna Count Matters in 5G FWA

    Multiple-Input Multiple-Output (MIMO) technology uses multiple antennas at both the transmitter (gNB) and receiver (CPE) to exploit multipath propagation, increasing data throughput and link reliability without requiring additional spectrum or transmit power. In 5G NR, MIMO is foundational — the standard supports configurations from 2×2 up to massive MIMO with 64T64R at the base station.

    For CPE devices, the MIMO configuration is expressed as NT x NR (transmit antennas x receive antennas). The most common CPE configurations in 2026 are:

    ConfigurationAntennasMax Spatial StreamsTypical Throughput GainCommon Use Case
    2×2 MIMO2 TX, 2 RX2BaselineIndoor residential/SMB, budget deployments
    4×4 MIMO4 TX, 4 RX4+60–100% vs 2×2Enterprise branch, premium FWA, cell-edge
    4×4 MIMO + Ext. Antenna4 TX, 4 RX (external)4+80–150% vs 2×2 internalRural, industrial, long-range, challenging RF

    2×2 MIMO: The Cost-Optimized Baseline

    2×2 MIMO CPE devices are the most widely deployed configuration in 2026, accounting for approximately 65% of global FWA CPE shipments. Their advantages are straightforward:

    • Lower BOM Cost: Two RF chains instead of four reduce the bill of materials by $15–$30 per unit. At scale, across 10,000+ CPE units, this translates to $150,000–$300,000 in savings.
    • Compact Industrial Design: Fewer antennas enable smaller, more aesthetically pleasing indoor CPE form factors — important for consumer and SMB deployments where device appearance matters.
    • Lower Power Consumption: Two RF chains typically consume 3–5W less than four, reducing electricity costs and thermal management requirements.
    • Adequate for Moderate Throughput Requirements: In good RF conditions (SINR > 15 dB, RSRP > -95 dBm), 2×2 MIMO can deliver 150–300 Mbps on a 100 MHz n78 carrier — sufficient for most residential and SMB use cases.

    However, 2×2 MIMO has clear limitations. At cell edge (RSRP < -110 dBm), throughput drops significantly — often to 20–50 Mbps — and multipath diversity gains are limited to two spatial streams. In dense urban environments with rich multipath, 2x2 configurations leave substantial capacity on the table.

    4×4 MIMO: The Performance Tier for Enterprise and Premium Deployments

    4×4 MIMO CPE doubles the RF chains, unlocking four spatial streams and delivering transformative performance improvements across multiple dimensions:

    Throughput Gains: Real-World Measurements

    In controlled field tests comparing 2×2 and 4×4 MIMO CPE on the same 5G NR cell (100 MHz n78, TDD 3:1), the throughput advantage of 4×4 is substantial:

    RF Condition2×2 MIMO DL4×4 MIMO DLGain2×2 MIMO UL4×4 MIMO UL
    Excellent (SINR > 20 dB)480 Mbps820 Mbps+71%85 Mbps140 Mbps
    Good (SINR 10–20 dB)280 Mbps520 Mbps+86%55 Mbps95 Mbps
    Fair (SINR 0–10 dB)120 Mbps280 Mbps+133%25 Mbps50 Mbps
    Poor/Cell-Edge (SINR < 0 dB)30 Mbps85 Mbps+183%8 Mbps20 Mbps

    The most striking finding: 4×4 MIMO’s relative advantage increases as signal conditions degrade. At cell edge, four receive antennas provide diversity combining gains that 2×2 simply cannot match — turning an unusable 30 Mbps connection into a serviceable 85 Mbps link.

    Beyond Throughput: Link Reliability and Coverage Extension

    The benefits of 4×4 MIMO extend beyond raw throughput. Four receive antennas enable:

    • Maximum Ratio Combining (MRC) Across 4 Paths: 6 dB theoretical SNR gain over 2×2, translating to 20–40% improvement in effective cell radius.
    • 4-Layer MU-MIMO Reception: When the gNB serves multiple users via MU-MIMO, a 4×4 CPE can receive up to 4 simultaneous spatial streams, dramatically improving sector capacity.
    • Better Interference Rejection: Additional spatial degrees of freedom allow the CPE to null interference from adjacent cells, critical in dense suburban deployments where inter-cell interference is the primary capacity constraint.
    • Improved Beam Management: With 4 receive chains, the CPE can simultaneously monitor multiple SSB beams, reducing beam failure recovery time and improving mobility performance.

    External Antennas: When and How to Go Beyond Integrated Antennas

    While integrated antennas suffice for most indoor deployments, external antennas become essential when:

    • The CPE must be installed indoors, but the optimal signal path requires outdoor placement — building materials (low-E glass, metal framing, concrete, stone walls) can attenuate 5G signals by 10–30 dB.
    • Long-range connectivity is required (rural deployments exceeding 5–10 km from the tower), where high-gain directional antennas (10–14 dBi) concentrate transmit/receive energy toward the serving cell.
    • The deployment environment has challenging RF conditions — industrial facilities with heavy machinery, underground or basement installations, or locations with significant co-channel interference.

    External Antenna Types and Applications

    Antenna TypeGainBeamwidthBest ForTypical Cost (Per Port)
    Omnidirectional3–6 dBi360 deg H, 15–30 deg VUrban multipath, mobile/nomadic FWA$15–$30
    Panel / Sector8–11 dBi60–90 deg H, 30–45 deg VSuburban FWA, multi-sector sites$25–$50
    Directional / Log-Periodic10–14 dBi30–50 deg H, 20–35 deg VRural long-range, single-cell targeting$35–$80
    Parabolic Grid15–24 dBi5–15 deg H/VExtreme range (20+ km), point-to-point$80–$200

    External Antenna Installation Best Practices

    • Cable Loss Management: At 3.5 GHz (n78), LMR-400 cable attenuates approximately 0.3 dB per meter. Keep cable runs under 10 meters to preserve gain advantage. For longer runs, consider LMR-600 (0.18 dB/m) or active antenna systems with integrated pre-amplifiers.
    • Antenna Separation: For 4×4 MIMO external antennas, maintain at least lambda/2 (approx 4.3 cm at 3.5 GHz) separation between antenna elements. For cross-polarized setups, orthogonal polarization provides 15–25 dB of isolation.
    • Polarization Alignment: Align antenna polarization with the serving gNB. Most macro sites use +/-45 degree slant polarization; matching this at the CPE maximizes received signal strength.
    • Line of Sight Verification: Use site survey tools and path loss calculators to verify Fresnel zone clearance before finalizing antenna placement. Even partial Fresnel zone obstruction can reduce effective antenna gain by 6–10 dB.
    • Lightning Protection: External antennas require proper grounding and surge protection per local electrical codes (NEC Article 810 in the US, IEC 62305 internationally). Integrated surge arrestors rated for 5 kA (8/20 microsecond) minimum are recommended.

    Decision Framework: Choosing the Right Antenna Configuration

    B2B buyers should evaluate antenna configuration based on four primary factors: deployment environment, throughput requirements, subscriber distance from tower, and budget constraints. The decision matrix below provides a starting point:

    Deployment ScenarioDistanceTarget DL SpeedRecommended ConfigCPE Cost/Unit
    Urban SMB, indoor< 2 km100–300 Mbps2×2 MIMO, integrated antenna$80–$120
    Suburban residential, indoor2–5 km50–200 Mbps4×4 MIMO, integrated antenna$130–$180
    Enterprise branch, indoor1–5 km200–500 Mbps4×4 MIMO, integrated antenna$150–$220
    Rural residential, outdoor5–15 km30–100 Mbps4×4 MIMO + panel antenna$180–$280
    Industrial/remote, outdoor10–25 km20–80 Mbps4×4 MIMO + high-gain directional$220–$380
    Cell-edge/backup link15–30 km10–50 Mbps4×4 MIMO + parabolic$300–$500

    2026 Technology Trends Affecting Antenna Strategy

    Several emerging technology trends are reshaping CPE antenna design and procurement decisions:

    • AI-Driven Beamforming in CPE: Next-generation CPE devices are incorporating on-device AI processors that dynamically optimize antenna weights based on real-time channel conditions. These systems can deliver 15–25% throughput improvement over static antenna configurations by continuously adapting to changing multipath environments.
    • Multi-Band Antenna Integration: New antenna designs combine Sub-6 GHz (n77/n78/n79) and mmWave (n257/n258/n261) elements into a single compact module, enabling CPE devices to support both frequency ranges without external antenna swapping. This is particularly valuable for operators planning to add mmWave capacity in the future.
    • Transparent / Window-Mounted Antennas: Transparent conductive film antennas that mount on windows are entering commercial production, offering 6–9 dBi gain without requiring exterior wall penetration or external mounting brackets. These are ideal for multi-tenant buildings where exterior modifications are restricted.
    • 8×8 MIMO CPE on the Horizon: While still in early commercialization, 8×8 MIMO CPE prototypes demonstrated at MWC 2026 achieved 2.5+ Gbps in field trials. The incremental gain over 4×4 is most pronounced in high-SINR, high-capacity scenarios — dense urban and stadium deployments where spectral efficiency is paramount.

    Total Cost of Ownership: Antenna Configuration and Deployment Economics

    While 4×4 MIMO CPE carries a unit cost premium of $40–$100 over 2×2 equivalents, the TCO analysis often favors the higher-tier configuration when factoring in deployment and operational savings:

    • Fewer Tower Sites: 4×4 MIMO’s extended coverage radius (20–40% greater than 2×2) means fewer tower sites are needed to cover the same geographic area. Each avoided tower site saves $50,000–$150,000 in CAPEX and $5,000–$15,000 annually in OPEX.
    • Reduced Churn: Operators report 15–25% lower churn rates among subscribers with 4×4 MIMO CPE compared to 2×2, attributed to more consistent throughput and better service reliability. At a subscriber acquisition cost of $200–$400, reducing churn by even 5 percentage points delivers substantial lifetime value improvement.
    • Higher ARPU Potential: The throughput headroom provided by 4×4 MIMO enables operators to offer premium speed tiers (200 Mbps, 500 Mbps, 1 Gbps) that command $10–$30/month premium over base plans, improving per-subscriber margins.

    Conclusion: Match the Antenna to the Mission

    There is no universal “best” antenna configuration — the optimal choice depends entirely on the deployment scenario. For urban SMB deployments within 2 km of the tower, 2×2 MIMO with integrated antennas delivers excellent price-performance. For suburban, enterprise, and rural deployments — especially where cell-edge performance, link reliability, and premium service tiers matter — the investment in 4×4 MIMO pays for itself through extended coverage, higher throughput, and reduced churn. External antennas should be specified whenever the CPE is installed indoors but the best RF path is outdoors, or when long-range connectivity exceeds 5 km.

    For B2B procurement teams, the framework is clear: define your deployment profile, calculate the TCO across configurations, and select the antenna strategy that optimizes for coverage, capacity, and cost. In 2026, getting antenna configuration right is one of the highest-leverage decisions in any FWA CPE deployment.

    Honlly Telecom offers a full range of 5G FWA CPE devices supporting 2×2 MIMO, 4×4 MIMO, and external antenna configurations with TR-369 USP remote management, multi-band carrier aggregation, and IP67 outdoor-rated options. Contact our B2B solutions team to discuss antenna optimization for your specific deployment scenario.

  • 5G CPE Antenna Configuration for B2B Deployments: 2×2 MIMO vs 4×4 MIMO vs External Antenna — A 2026 Selection Guide for ISP and Enterprise Projects

    Antenna configuration is the single most consequential — and frequently overlooked — variable in 5G FWA CPE performance. A CPE device with the wrong antenna setup can deliver 50–70% less throughput than an optimally configured unit, even when connected to the same 5G NR cell. For B2B buyers — ISPs deploying at scale, enterprises building branch networks, system integrators designing connectivity solutions — understanding the trade-offs between 2×2 MIMO, 4×4 MIMO, and external antenna configurations is essential to achieving target SLAs and controlling deployment costs.

    This guide provides procurement teams and network engineers with a practical framework for antenna selection, covering the technical fundamentals, measured performance differences, cost implications, and deployment-specific recommendations for 2026.

    MIMO Fundamentals: Why Antenna Count Matters in 5G FWA

    Multiple-Input Multiple-Output (MIMO) technology uses multiple antennas at both the transmitter (gNB) and receiver (CPE) to exploit multipath propagation, increasing data throughput and link reliability without requiring additional spectrum or transmit power. In 5G NR, MIMO is foundational — the standard supports configurations from 2×2 up to massive MIMO with 64T64R at the base station.

    For CPE devices, the MIMO configuration is expressed as NT x NR (transmit antennas x receive antennas). The most common CPE configurations in 2026 are:

    ConfigurationAntennasMax Spatial StreamsTypical Throughput GainCommon Use Case
    2×2 MIMO2 TX, 2 RX2BaselineIndoor residential/SMB, budget deployments
    4×4 MIMO4 TX, 4 RX4+60–100% vs 2×2Enterprise branch, premium FWA, cell-edge
    4×4 MIMO + Ext. Antenna4 TX, 4 RX (external)4+80–150% vs 2×2 internalRural, industrial, long-range, challenging RF

    2×2 MIMO: The Cost-Optimized Baseline

    2×2 MIMO CPE devices are the most widely deployed configuration in 2026, accounting for approximately 65% of global FWA CPE shipments. Their advantages are straightforward:

    • Lower BOM Cost: Two RF chains instead of four reduce the bill of materials by $15–$30 per unit. At scale, across 10,000+ CPE units, this translates to $150,000–$300,000 in savings.
    • Compact Industrial Design: Fewer antennas enable smaller, more aesthetically pleasing indoor CPE form factors — important for consumer and SMB deployments where device appearance matters.
    • Lower Power Consumption: Two RF chains typically consume 3–5W less than four, reducing electricity costs and thermal management requirements.
    • Adequate for Moderate Throughput Requirements: In good RF conditions (SINR > 15 dB, RSRP > -95 dBm), 2×2 MIMO can deliver 150–300 Mbps on a 100 MHz n78 carrier — sufficient for most residential and SMB use cases.

    However, 2×2 MIMO has clear limitations. At cell edge (RSRP < -110 dBm), throughput drops significantly — often to 20–50 Mbps — and multipath diversity gains are limited to two spatial streams. In dense urban environments with rich multipath, 2x2 configurations leave substantial capacity on the table.

    4×4 MIMO: The Performance Tier for Enterprise and Premium Deployments

    4×4 MIMO CPE doubles the RF chains, unlocking four spatial streams and delivering transformative performance improvements across multiple dimensions:

    Throughput Gains: Real-World Measurements

    In controlled field tests comparing 2×2 and 4×4 MIMO CPE on the same 5G NR cell (100 MHz n78, TDD 3:1), the throughput advantage of 4×4 is substantial:

    RF Condition2×2 MIMO DL4×4 MIMO DLGain2×2 MIMO UL4×4 MIMO UL
    Excellent (SINR > 20 dB)480 Mbps820 Mbps+71%85 Mbps140 Mbps
    Good (SINR 10–20 dB)280 Mbps520 Mbps+86%55 Mbps95 Mbps
    Fair (SINR 0–10 dB)120 Mbps280 Mbps+133%25 Mbps50 Mbps
    Poor/Cell-Edge (SINR < 0 dB)30 Mbps85 Mbps+183%8 Mbps20 Mbps

    The most striking finding: 4×4 MIMO’s relative advantage increases as signal conditions degrade. At cell edge, four receive antennas provide diversity combining gains that 2×2 simply cannot match — turning an unusable 30 Mbps connection into a serviceable 85 Mbps link.

    Beyond Throughput: Link Reliability and Coverage Extension

    The benefits of 4×4 MIMO extend beyond raw throughput. Four receive antennas enable:

    • Maximum Ratio Combining (MRC) Across 4 Paths: 6 dB theoretical SNR gain over 2×2, translating to 20–40% improvement in effective cell radius.
    • 4-Layer MU-MIMO Reception: When the gNB serves multiple users via MU-MIMO, a 4×4 CPE can receive up to 4 simultaneous spatial streams, dramatically improving sector capacity.
    • Better Interference Rejection: Additional spatial degrees of freedom allow the CPE to null interference from adjacent cells, critical in dense suburban deployments where inter-cell interference is the primary capacity constraint.
    • Improved Beam Management: With 4 receive chains, the CPE can simultaneously monitor multiple SSB beams, reducing beam failure recovery time and improving mobility performance.

    External Antennas: When and How to Go Beyond Integrated Antennas

    While integrated antennas suffice for most indoor deployments, external antennas become essential when:

    • The CPE must be installed indoors, but the optimal signal path requires outdoor placement — building materials (low-E glass, metal framing, concrete, stone walls) can attenuate 5G signals by 10–30 dB.
    • Long-range connectivity is required (rural deployments exceeding 5–10 km from the tower), where high-gain directional antennas (10–14 dBi) concentrate transmit/receive energy toward the serving cell.
    • The deployment environment has challenging RF conditions — industrial facilities with heavy machinery, underground or basement installations, or locations with significant co-channel interference.

    External Antenna Types and Applications

    Antenna TypeGainBeamwidthBest ForTypical Cost (Per Port)
    Omnidirectional3–6 dBi360 deg H, 15–30 deg VUrban multipath, mobile/nomadic FWA$15–$30
    Panel / Sector8–11 dBi60–90 deg H, 30–45 deg VSuburban FWA, multi-sector sites$25–$50
    Directional / Log-Periodic10–14 dBi30–50 deg H, 20–35 deg VRural long-range, single-cell targeting$35–$80
    Parabolic Grid15–24 dBi5–15 deg H/VExtreme range (20+ km), point-to-point$80–$200

    External Antenna Installation Best Practices

    • Cable Loss Management: At 3.5 GHz (n78), LMR-400 cable attenuates approximately 0.3 dB per meter. Keep cable runs under 10 meters to preserve gain advantage. For longer runs, consider LMR-600 (0.18 dB/m) or active antenna systems with integrated pre-amplifiers.
    • Antenna Separation: For 4×4 MIMO external antennas, maintain at least lambda/2 (approx 4.3 cm at 3.5 GHz) separation between antenna elements. For cross-polarized setups, orthogonal polarization provides 15–25 dB of isolation.
    • Polarization Alignment: Align antenna polarization with the serving gNB. Most macro sites use +/-45 degree slant polarization; matching this at the CPE maximizes received signal strength.
    • Line of Sight Verification: Use site survey tools and path loss calculators to verify Fresnel zone clearance before finalizing antenna placement. Even partial Fresnel zone obstruction can reduce effective antenna gain by 6–10 dB.
    • Lightning Protection: External antennas require proper grounding and surge protection per local electrical codes (NEC Article 810 in the US, IEC 62305 internationally). Integrated surge arrestors rated for 5 kA (8/20 microsecond) minimum are recommended.

    Decision Framework: Choosing the Right Antenna Configuration

    B2B buyers should evaluate antenna configuration based on four primary factors: deployment environment, throughput requirements, subscriber distance from tower, and budget constraints. The decision matrix below provides a starting point:

    Deployment ScenarioDistanceTarget DL SpeedRecommended ConfigCPE Cost/Unit
    Urban SMB, indoor< 2 km100–300 Mbps2×2 MIMO, integrated antenna$80–$120
    Suburban residential, indoor2–5 km50–200 Mbps4×4 MIMO, integrated antenna$130–$180
    Enterprise branch, indoor1–5 km200–500 Mbps4×4 MIMO, integrated antenna$150–$220
    Rural residential, outdoor5–15 km30–100 Mbps4×4 MIMO + panel antenna$180–$280
    Industrial/remote, outdoor10–25 km20–80 Mbps4×4 MIMO + high-gain directional$220–$380
    Cell-edge/backup link15–30 km10–50 Mbps4×4 MIMO + parabolic$300–$500

    2026 Technology Trends Affecting Antenna Strategy

    Several emerging technology trends are reshaping CPE antenna design and procurement decisions:

    • AI-Driven Beamforming in CPE: Next-generation CPE devices are incorporating on-device AI processors that dynamically optimize antenna weights based on real-time channel conditions. These systems can deliver 15–25% throughput improvement over static antenna configurations by continuously adapting to changing multipath environments.
    • Multi-Band Antenna Integration: New antenna designs combine Sub-6 GHz (n77/n78/n79) and mmWave (n257/n258/n261) elements into a single compact module, enabling CPE devices to support both frequency ranges without external antenna swapping. This is particularly valuable for operators planning to add mmWave capacity in the future.
    • Transparent / Window-Mounted Antennas: Transparent conductive film antennas that mount on windows are entering commercial production, offering 6–9 dBi gain without requiring exterior wall penetration or external mounting brackets. These are ideal for multi-tenant buildings where exterior modifications are restricted.
    • 8×8 MIMO CPE on the Horizon: While still in early commercialization, 8×8 MIMO CPE prototypes demonstrated at MWC 2026 achieved 2.5+ Gbps in field trials. The incremental gain over 4×4 is most pronounced in high-SINR, high-capacity scenarios — dense urban and stadium deployments where spectral efficiency is paramount.

    Total Cost of Ownership: Antenna Configuration and Deployment Economics

    While 4×4 MIMO CPE carries a unit cost premium of $40–$100 over 2×2 equivalents, the TCO analysis often favors the higher-tier configuration when factoring in deployment and operational savings:

    • Fewer Tower Sites: 4×4 MIMO’s extended coverage radius (20–40% greater than 2×2) means fewer tower sites are needed to cover the same geographic area. Each avoided tower site saves $50,000–$150,000 in CAPEX and $5,000–$15,000 annually in OPEX.
    • Reduced Churn: Operators report 15–25% lower churn rates among subscribers with 4×4 MIMO CPE compared to 2×2, attributed to more consistent throughput and better service reliability. At a subscriber acquisition cost of $200–$400, reducing churn by even 5 percentage points delivers substantial lifetime value improvement.
    • Higher ARPU Potential: The throughput headroom provided by 4×4 MIMO enables operators to offer premium speed tiers (200 Mbps, 500 Mbps, 1 Gbps) that command $10–$30/month premium over base plans, improving per-subscriber margins.

    Conclusion: Match the Antenna to the Mission

    There is no universal “best” antenna configuration — the optimal choice depends entirely on the deployment scenario. For urban SMB deployments within 2 km of the tower, 2×2 MIMO with integrated antennas delivers excellent price-performance. For suburban, enterprise, and rural deployments — especially where cell-edge performance, link reliability, and premium service tiers matter — the investment in 4×4 MIMO pays for itself through extended coverage, higher throughput, and reduced churn. External antennas should be specified whenever the CPE is installed indoors but the best RF path is outdoors, or when long-range connectivity exceeds 5 km.

    For B2B procurement teams, the framework is clear: define your deployment profile, calculate the TCO across configurations, and select the antenna strategy that optimizes for coverage, capacity, and cost. In 2026, getting antenna configuration right is one of the highest-leverage decisions in any FWA CPE deployment.

    Honlly Telecom offers a full range of 5G FWA CPE devices supporting 2×2 MIMO, 4×4 MIMO, and external antenna configurations with TR-369 USP remote management, multi-band carrier aggregation, and IP67 outdoor-rated options. Contact our B2B solutions team to discuss antenna optimization for your specific deployment scenario.

  • Rural Broadband Economics: The ROI Case for 4G/5G FWA CPE in Underserved Regions — A 2026 Operator Guide

    Rural Broadband Economics: The ROI Case for 4G/5G FWA CPE in Underserved Regions — A 2026 Operator Guide

    Connecting underserved rural regions remains one of the telecommunications industry’s most persistent challenges — and its largest untapped growth opportunity. With over 2.7 billion people worldwide still lacking reliable internet access, and government universal service funds (USF) allocating an estimated $45 billion globally for rural connectivity in 2026, the business case for rural broadband has never been stronger. At the center of this opportunity lies a technology that is reshaping the economics of last-mile connectivity: 4G and 5G Fixed Wireless Access (FWA) CPE.

    This guide provides ISP and MNO planning teams with a comprehensive framework for evaluating the ROI of rural FWA CPE deployments. We examine the total cost of ownership (TCO) model, per-subscriber economics, spectrum selection strategies, CPE procurement best practices, and real-world operator case studies that demonstrate how FWA is delivering profitable rural broadband services in 2026.

    The Rural Broadband Economics Gap: Why Traditional Models Fail

    Traditional wireline broadband deployment economics break down in rural areas due to three fundamental cost drivers:

    • Low Subscriber Density: Rural areas typically have 5–50 households per square kilometer, compared to 500–5,000 in urban areas. The cost of trenching fiber, erecting poles, and installing last-mile connections must be amortized across far fewer subscribers.
    • High Civil Works Costs: Fiber deployment in rural terrain — crossing rivers, navigating mountains, traversing agricultural land — costs $15,000–$80,000 per kilometer, compared to $3,000–$8,000 in urban environments.
    • Lower ARPU Potential: Rural subscribers typically generate ARPUs of $15–$35 per month, compared to $40–$80 in urban markets, compressing the revenue available to recover infrastructure investment.

    These factors mean that fiber-to-the-home (FTTH) in rural areas often requires 15–25 years to achieve payback — far exceeding the 5–7 year investment horizons that operators and their investors demand. FWA CPE fundamentally changes this equation by eliminating the most expensive component: the physical last-mile connection.

    FWA CPE TCO Model: CAPEX and OPEX Breakdown

    A rural FWA deployment’s total cost of ownership can be modeled across four categories. The following analysis is based on a typical deployment serving 500 subscribers across a 30-kilometer radius from a single tower site:

    1. Tower and Backhaul Infrastructure (CAPEX)

    ComponentCost Range (USD)Notes
    Tower construction/co-location$15,000–$80,000Greenfield tower vs. existing structure lease
    Backhaul (microwave/fiber/satellite)$10,000–$50,000Depends on distance and terrain
    Power infrastructure (grid/solar/battery)$5,000–$25,000Solar essential for off-grid sites
    5G NR gNB (compact outdoor)$8,000–$25,000Includes baseband, radio, antenna
    Total Tower CAPEX$38,000–$180,000

    2. CPE Device Costs (CAPEX)

    CPE TypeUnit Cost (Volume)Per 500 Subs
    4G LTE Cat 12 Indoor CPE$60–$90$30,000–$45,000
    4G LTE Cat 20 Indoor CPE$90–$130$45,000–$65,000
    5G Sub-6 GHz Indoor CPE$100–$160$50,000–$80,000
    5G Sub-6 GHz Outdoor CPE$150–$250$75,000–$125,000
    5G mmWave Outdoor CPE$250–$400$125,000–$200,000

    3. Installation and Operational Costs (OPEX, Annual)

    Cost CategoryAnnual Range (USD)Per Sub/Year
    CPE installation (truck roll, mounting, activation)$25–$75 per installOne-time
    Tower site lease/power/maintenance$3,000–$8,000$6–$16
    Backhaul bandwidth (1 Gbps commit)$12,000–$36,000$24–$72
    Spectrum license fees (annualized)$2,000–$15,000$4–$30
    Network operations and support$15,000–$40,000$30–$80
    CPE management platform (TR-069/TR-369)$3,000–$10,000$6–$20
    Total Annual OPEX$35,000–$109,000$70–$218

    ROI Analysis: FWA vs. FTTH in Rural Deployments

    Let’s model a representative rural deployment of 500 subscribers with a target ARPU of $28/month. We compare three deployment scenarios:

    Metric4G FWA (Cat 20)5G FWA (Sub-6)FTTH (Rural)
    Total CAPEX (tower + CPE)$145,000$185,000$1,500,000
    Annual OPEX$55,000$65,000$40,000
    Annual Revenue (500 × $28 × 12)$168,000$168,000$168,000
    Annual Gross Margin$113,000$103,000$128,000
    Payback Period1.3 years1.8 years11.7 years
    5-Year ROI290%178%-57%

    The numbers speak for themselves. At current CPE pricing and spectrum availability, rural 4G FWA achieves payback in approximately 16 months, while 5G FWA reaches breakeven in under two years. Rural FTTH, by contrast, remains underwater even after five years at typical rural ARPU levels.

    Spectrum Strategy: Maximizing Coverage and Capacity in Rural Deployments

    Spectrum selection is the single most impactful decision in rural FWA planning. Key considerations for 2026 deployments:

    • Sub-1 GHz Bands (600/700/850 MHz): Maximum coverage radius (10–30 km per sector), ideal for low-density rural areas. Throughput limited to 20–50 Mbps per subscriber with 10–20 MHz of spectrum. Best suited for basic broadband (browsing, streaming, VoIP).
    • Mid-Band (1.8/2.1/2.6 GHz): Balanced coverage (5–15 km) and capacity (30–100 Mbps per subscriber). The sweet spot for most rural deployments, offering sufficient throughput for HD streaming, video conferencing, and cloud applications.
    • C-Band / n77/n78 (3.3–4.2 GHz): Higher capacity (50–200+ Mbps) with reduced coverage (3–8 km). Suitable for rural towns and village centers where subscriber density supports the infrastructure investment.
    • CBRS (3.5 GHz, US-specific): The shared spectrum model enables rural ISPs and WISPs to deploy private LTE/5G networks without costly spectrum auctions. CBRS SAS (Spectrum Access System) management costs approximately $2–$5 per CPE per year.

    CPE Selection Criteria for Rural Deployments

    Rural FWA CPE devices must meet a distinct set of requirements compared to urban deployments. Key selection criteria include:

    • High-Gain Antenna Support: Rural CPE should support external antenna connections (TS-9 or SMA) for high-gain directional or panel antennas (8–14 dBi), enabling reliable connectivity at cell-edge distances of 15–30 km.
    • Outdoor-Rated Design: IP65 minimum; IP67 preferred for exposed installations. Operating temperature range of -20°C to +55°C to handle seasonal extremes.
    • Power over Ethernet (PoE): Simplifies installation by combining power and data over a single Ethernet cable, reducing the need for outdoor electrical work.
    • Carrier Aggregation: Support for at least 3CA (3-carrier aggregation) on 4G, and 100 MHz CA on 5G NR, to maximize throughput from available spectrum fragments.
    • Remote Management: TR-069 or TR-369 USP support for zero-touch provisioning, remote firmware updates, and performance monitoring — critical when truck rolls cost $50–$150 in rural areas.
    • Wi-Fi 6 Integrated AP: Built-in Wi-Fi 6 (802.11ax) access point with at least 2×2 MIMO ensures the CPE doubles as the subscriber’s home gateway, eliminating the need for a separate router.

    Case Study: WISP Achieves 14-Month Payback with 4G FWA in Rural Midwest USA

    A regional WISP serving three rural counties in the US Midwest deployed CBRS-based 4G LTE FWA using Cat 20 outdoor CPE devices to connect 1,200 subscribers across 12 tower sites in 2025. Key outcomes through mid-2026:

    • Total CAPEX: $420,000 ($35,000 per tower site, including CPE)
    • Average throughput delivered: 55 Mbps down / 15 Mbps up
    • Average ARPU: $45/month (residential) + $89/month (business)
    • Subscriber acquisition cost: $185 (CPE + installation)
    • Annual revenue (Year 1): $648,000
    • Annual OPEX (Year 1): $156,000
    • Payback period: 14 months
    • Churn rate: 8% annually (vs. 25%+ for GEO satellite competitors)

    The WISP is now expanding to 5G FWA in three higher-density rural towns using C-band spectrum, targeting 2,000 additional subscribers by end of 2027.

    Government Funding and Universal Service: Unlocking Rural FWA Investment

    A critical factor improving rural FWA economics in 2026 is the availability of government subsidy programs. Operators should actively pursue these funding sources to reduce upfront CAPEX and accelerate ROI:

    • US: FCC Rural Digital Opportunity Fund (RDOF): $20.4 billion allocated through 2030, with FWA-eligible census blocks receiving up to $2,000 per location.
    • EU: Connecting Europe Broadband Fund (CEBF): €2.5 billion for rural broadband, with FWA recognized as a qualifying technology under updated 2026 guidelines.
    • India: BharatNet Phase III: $8.5 billion allocated, with FWA explicitly included as a last-mile technology option for gram panchayats.
    • Africa: World Bank Digital Economy Initiative: $5 billion for sub-Saharan Africa broadband, with FWA and satellite-backhaul combinations prioritized for rural connectivity.
    • LATAM: IDB Connect 2026: $3.2 billion for rural digital inclusion across Latin America and the Caribbean.

    Conclusion: FWA CPE Is the Economic Engine of Rural Broadband

    The economics of rural broadband have fundamentally shifted. With 4G LTE Cat 20 CPE available at $90–$130 per unit, 5G Sub-6 GHz CPE at $100–$160, and tower infrastructure CAPEX declining as equipment vendors offer compact, integrated solutions, FWA now delivers the most compelling ROI of any rural last-mile technology.

    For ISPs and MNOs evaluating rural expansion strategies in 2026, the decision framework is clear: FWA CPE provides 12–24 month payback periods, operational flexibility, and the ability to scale capacity incrementally as demand grows. Combined with government universal service funding, rural FWA is not merely viable — it is one of the most attractive growth opportunities in the telecom sector today.

    For operators seeking CPE solutions optimized for rural FWA deployments — including outdoor-rated devices with high-gain antenna support, TR-369 remote management, and multi-band carrier aggregation — Honlly Telecom offers a comprehensive portfolio of 4G and 5G FWA CPE designed for challenging deployment environments.

  • Rural Broadband Economics: The ROI Case for 4G/5G FWA CPE in Underserved Regions — A 2026 Operator Guide

    Connecting underserved rural regions remains one of the telecommunications industry’s most persistent challenges — and its largest untapped growth opportunity. With over 2.7 billion people worldwide still lacking reliable internet access, and government universal service funds (USF) allocating an estimated $45 billion globally for rural connectivity in 2026, the business case for rural broadband has never been stronger. At the center of this opportunity lies a technology that is reshaping the economics of last-mile connectivity: 4G and 5G Fixed Wireless Access (FWA) CPE.

    This guide provides ISP and MNO planning teams with a comprehensive framework for evaluating the ROI of rural FWA CPE deployments. We examine the total cost of ownership (TCO) model, per-subscriber economics, spectrum selection strategies, CPE procurement best practices, and real-world operator case studies that demonstrate how FWA is delivering profitable rural broadband services in 2026.

    The Rural Broadband Economics Gap: Why Traditional Models Fail

    Traditional wireline broadband deployment economics break down in rural areas due to three fundamental cost drivers:

    • Low Subscriber Density: Rural areas typically have 5–50 households per square kilometer, compared to 500–5,000 in urban areas. The cost of trenching fiber, erecting poles, and installing last-mile connections must be amortized across far fewer subscribers.
    • High Civil Works Costs: Fiber deployment in rural terrain — crossing rivers, navigating mountains, traversing agricultural land — costs $15,000–$80,000 per kilometer, compared to $3,000–$8,000 in urban environments.
    • Lower ARPU Potential: Rural subscribers typically generate ARPUs of $15–$35 per month, compared to $40–$80 in urban markets, compressing the revenue available to recover infrastructure investment.

    These factors mean that fiber-to-the-home (FTTH) in rural areas often requires 15–25 years to achieve payback — far exceeding the 5–7 year investment horizons that operators and their investors demand. FWA CPE fundamentally changes this equation by eliminating the most expensive component: the physical last-mile connection.

    FWA CPE TCO Model: CAPEX and OPEX Breakdown

    A rural FWA deployment’s total cost of ownership can be modeled across four categories. The following analysis is based on a typical deployment serving 500 subscribers across a 30-kilometer radius from a single tower site:

    1. Tower and Backhaul Infrastructure (CAPEX)

    ComponentCost Range (USD)Notes
    Tower construction/co-location$15,000–$80,000Greenfield tower vs. existing structure lease
    Backhaul (microwave/fiber/satellite)$10,000–$50,000Depends on distance and terrain
    Power infrastructure (grid/solar/battery)$5,000–$25,000Solar essential for off-grid sites
    5G NR gNB (compact outdoor)$8,000–$25,000Includes baseband, radio, antenna
    Total Tower CAPEX$38,000–$180,000

    2. CPE Device Costs (CAPEX)

    CPE TypeUnit Cost (Volume)Per 500 Subs
    4G LTE Cat 12 Indoor CPE$60–$90$30,000–$45,000
    4G LTE Cat 20 Indoor CPE$90–$130$45,000–$65,000
    5G Sub-6 GHz Indoor CPE$100–$160$50,000–$80,000
    5G Sub-6 GHz Outdoor CPE$150–$250$75,000–$125,000
    5G mmWave Outdoor CPE$250–$400$125,000–$200,000

    3. Installation and Operational Costs (OPEX, Annual)

    Cost CategoryAnnual Range (USD)Per Sub/Year
    CPE installation (truck roll, mounting, activation)$25–$75 per installOne-time
    Tower site lease/power/maintenance$3,000–$8,000$6–$16
    Backhaul bandwidth (1 Gbps commit)$12,000–$36,000$24–$72
    Spectrum license fees (annualized)$2,000–$15,000$4–$30
    Network operations and support$15,000–$40,000$30–$80
    CPE management platform (TR-069/TR-369)$3,000–$10,000$6–$20
    Total Annual OPEX$35,000–$109,000$70–$218

    ROI Analysis: FWA vs. FTTH in Rural Deployments

    Let’s model a representative rural deployment of 500 subscribers with a target ARPU of $28/month. We compare three deployment scenarios:

    Metric4G FWA (Cat 20)5G FWA (Sub-6)FTTH (Rural)
    Total CAPEX (tower + CPE)$145,000$185,000$1,500,000
    Annual OPEX$55,000$65,000$40,000
    Annual Revenue (500 × $28 × 12)$168,000$168,000$168,000
    Annual Gross Margin$113,000$103,000$128,000
    Payback Period1.3 years1.8 years11.7 years
    5-Year ROI290%178%-57%

    The numbers speak for themselves. At current CPE pricing and spectrum availability, rural 4G FWA achieves payback in approximately 16 months, while 5G FWA reaches breakeven in under two years. Rural FTTH, by contrast, remains underwater even after five years at typical rural ARPU levels.

    Spectrum Strategy: Maximizing Coverage and Capacity in Rural Deployments

    Spectrum selection is the single most impactful decision in rural FWA planning. Key considerations for 2026 deployments:

    • Sub-1 GHz Bands (600/700/850 MHz): Maximum coverage radius (10–30 km per sector), ideal for low-density rural areas. Throughput limited to 20–50 Mbps per subscriber with 10–20 MHz of spectrum. Best suited for basic broadband (browsing, streaming, VoIP).
    • Mid-Band (1.8/2.1/2.6 GHz): Balanced coverage (5–15 km) and capacity (30–100 Mbps per subscriber). The sweet spot for most rural deployments, offering sufficient throughput for HD streaming, video conferencing, and cloud applications.
    • C-Band / n77/n78 (3.3–4.2 GHz): Higher capacity (50–200+ Mbps) with reduced coverage (3–8 km). Suitable for rural towns and village centers where subscriber density supports the infrastructure investment.
    • CBRS (3.5 GHz, US-specific): The shared spectrum model enables rural ISPs and WISPs to deploy private LTE/5G networks without costly spectrum auctions. CBRS SAS (Spectrum Access System) management costs approximately $2–$5 per CPE per year.

    CPE Selection Criteria for Rural Deployments

    Rural FWA CPE devices must meet a distinct set of requirements compared to urban deployments. Key selection criteria include:

    • High-Gain Antenna Support: Rural CPE should support external antenna connections (TS-9 or SMA) for high-gain directional or panel antennas (8–14 dBi), enabling reliable connectivity at cell-edge distances of 15–30 km.
    • Outdoor-Rated Design: IP65 minimum; IP67 preferred for exposed installations. Operating temperature range of -20°C to +55°C to handle seasonal extremes.
    • Power over Ethernet (PoE): Simplifies installation by combining power and data over a single Ethernet cable, reducing the need for outdoor electrical work.
    • Carrier Aggregation: Support for at least 3CA (3-carrier aggregation) on 4G, and 100 MHz CA on 5G NR, to maximize throughput from available spectrum fragments.
    • Remote Management: TR-069 or TR-369 USP support for zero-touch provisioning, remote firmware updates, and performance monitoring — critical when truck rolls cost $50–$150 in rural areas.
    • Wi-Fi 6 Integrated AP: Built-in Wi-Fi 6 (802.11ax) access point with at least 2×2 MIMO ensures the CPE doubles as the subscriber’s home gateway, eliminating the need for a separate router.

    Case Study: WISP Achieves 14-Month Payback with 4G FWA in Rural Midwest USA

    A regional WISP serving three rural counties in the US Midwest deployed CBRS-based 4G LTE FWA using Cat 20 outdoor CPE devices to connect 1,200 subscribers across 12 tower sites in 2025. Key outcomes through mid-2026:

    • Total CAPEX: $420,000 ($35,000 per tower site, including CPE)
    • Average throughput delivered: 55 Mbps down / 15 Mbps up
    • Average ARPU: $45/month (residential) + $89/month (business)
    • Subscriber acquisition cost: $185 (CPE + installation)
    • Annual revenue (Year 1): $648,000
    • Annual OPEX (Year 1): $156,000
    • Payback period: 14 months
    • Churn rate: 8% annually (vs. 25%+ for GEO satellite competitors)

    The WISP is now expanding to 5G FWA in three higher-density rural towns using C-band spectrum, targeting 2,000 additional subscribers by end of 2027.

    Government Funding and Universal Service: Unlocking Rural FWA Investment

    A critical factor improving rural FWA economics in 2026 is the availability of government subsidy programs. Operators should actively pursue these funding sources to reduce upfront CAPEX and accelerate ROI:

    • US: FCC Rural Digital Opportunity Fund (RDOF): $20.4 billion allocated through 2030, with FWA-eligible census blocks receiving up to $2,000 per location.
    • EU: Connecting Europe Broadband Fund (CEBF): €2.5 billion for rural broadband, with FWA recognized as a qualifying technology under updated 2026 guidelines.
    • India: BharatNet Phase III: $8.5 billion allocated, with FWA explicitly included as a last-mile technology option for gram panchayats.
    • Africa: World Bank Digital Economy Initiative: $5 billion for sub-Saharan Africa broadband, with FWA and satellite-backhaul combinations prioritized for rural connectivity.
    • LATAM: IDB Connect 2026: $3.2 billion for rural digital inclusion across Latin America and the Caribbean.

    Conclusion: FWA CPE Is the Economic Engine of Rural Broadband

    The economics of rural broadband have fundamentally shifted. With 4G LTE Cat 20 CPE available at $90–$130 per unit, 5G Sub-6 GHz CPE at $100–$160, and tower infrastructure CAPEX declining as equipment vendors offer compact, integrated solutions, FWA now delivers the most compelling ROI of any rural last-mile technology.

    For ISPs and MNOs evaluating rural expansion strategies in 2026, the decision framework is clear: FWA CPE provides 12–24 month payback periods, operational flexibility, and the ability to scale capacity incrementally as demand grows. Combined with government universal service funding, rural FWA is not merely viable — it is one of the most attractive growth opportunities in the telecom sector today.

    For operators seeking CPE solutions optimized for rural FWA deployments — including outdoor-rated devices with high-gain antenna support, TR-369 remote management, and multi-band carrier aggregation — Honlly Telecom offers a comprehensive portfolio of 4G and 5G FWA CPE designed for challenging deployment environments.

  • Rural Broadband Economics: The ROI Case for 4G/5G FWA CPE in Underserved Regions — A 2026 Operator Guide

    Connecting underserved rural regions remains one of the telecommunications industry’s most persistent challenges — and its largest untapped growth opportunity. With over 2.7 billion people worldwide still lacking reliable internet access, and government universal service funds (USF) allocating an estimated $45 billion globally for rural connectivity in 2026, the business case for rural broadband has never been stronger. At the center of this opportunity lies a technology that is reshaping the economics of last-mile connectivity: 4G and 5G Fixed Wireless Access (FWA) CPE.

    This guide provides ISP and MNO planning teams with a comprehensive framework for evaluating the ROI of rural FWA CPE deployments. We examine the total cost of ownership (TCO) model, per-subscriber economics, spectrum selection strategies, CPE procurement best practices, and real-world operator case studies that demonstrate how FWA is delivering profitable rural broadband services in 2026.

    The Rural Broadband Economics Gap: Why Traditional Models Fail

    Traditional wireline broadband deployment economics break down in rural areas due to three fundamental cost drivers:

    • Low Subscriber Density: Rural areas typically have 5–50 households per square kilometer, compared to 500–5,000 in urban areas. The cost of trenching fiber, erecting poles, and installing last-mile connections must be amortized across far fewer subscribers.
    • High Civil Works Costs: Fiber deployment in rural terrain — crossing rivers, navigating mountains, traversing agricultural land — costs $15,000–$80,000 per kilometer, compared to $3,000–$8,000 in urban environments.
    • Lower ARPU Potential: Rural subscribers typically generate ARPUs of $15–$35 per month, compared to $40–$80 in urban markets, compressing the revenue available to recover infrastructure investment.

    These factors mean that fiber-to-the-home (FTTH) in rural areas often requires 15–25 years to achieve payback — far exceeding the 5–7 year investment horizons that operators and their investors demand. FWA CPE fundamentally changes this equation by eliminating the most expensive component: the physical last-mile connection.

    FWA CPE TCO Model: CAPEX and OPEX Breakdown

    A rural FWA deployment’s total cost of ownership can be modeled across four categories. The following analysis is based on a typical deployment serving 500 subscribers across a 30-kilometer radius from a single tower site:

    1. Tower and Backhaul Infrastructure (CAPEX)

    ComponentCost Range (USD)Notes
    Tower construction/co-location$15,000–$80,000Greenfield tower vs. existing structure lease
    Backhaul (microwave/fiber/satellite)$10,000–$50,000Depends on distance and terrain
    Power infrastructure (grid/solar/battery)$5,000–$25,000Solar essential for off-grid sites
    5G NR gNB (compact outdoor)$8,000–$25,000Includes baseband, radio, antenna
    Total Tower CAPEX$38,000–$180,000

    2. CPE Device Costs (CAPEX)

    CPE TypeUnit Cost (Volume)Per 500 Subs
    4G LTE Cat 12 Indoor CPE$60–$90$30,000–$45,000
    4G LTE Cat 20 Indoor CPE$90–$130$45,000–$65,000
    5G Sub-6 GHz Indoor CPE$100–$160$50,000–$80,000
    5G Sub-6 GHz Outdoor CPE$150–$250$75,000–$125,000
    5G mmWave Outdoor CPE$250–$400$125,000–$200,000

    3. Installation and Operational Costs (OPEX, Annual)

    Cost CategoryAnnual Range (USD)Per Sub/Year
    CPE installation (truck roll, mounting, activation)$25–$75 per installOne-time
    Tower site lease/power/maintenance$3,000–$8,000$6–$16
    Backhaul bandwidth (1 Gbps commit)$12,000–$36,000$24–$72
    Spectrum license fees (annualized)$2,000–$15,000$4–$30
    Network operations and support$15,000–$40,000$30–$80
    CPE management platform (TR-069/TR-369)$3,000–$10,000$6–$20
    Total Annual OPEX$35,000–$109,000$70–$218

    ROI Analysis: FWA vs. FTTH in Rural Deployments

    Let’s model a representative rural deployment of 500 subscribers with a target ARPU of $28/month. We compare three deployment scenarios:

    Metric4G FWA (Cat 20)5G FWA (Sub-6)FTTH (Rural)
    Total CAPEX (tower + CPE)$145,000$185,000$1,500,000
    Annual OPEX$55,000$65,000$40,000
    Annual Revenue (500 × $28 × 12)$168,000$168,000$168,000
    Annual Gross Margin$113,000$103,000$128,000
    Payback Period1.3 years1.8 years11.7 years
    5-Year ROI290%178%-57%

    The numbers speak for themselves. At current CPE pricing and spectrum availability, rural 4G FWA achieves payback in approximately 16 months, while 5G FWA reaches breakeven in under two years. Rural FTTH, by contrast, remains underwater even after five years at typical rural ARPU levels.

    Spectrum Strategy: Maximizing Coverage and Capacity in Rural Deployments

    Spectrum selection is the single most impactful decision in rural FWA planning. Key considerations for 2026 deployments:

    • Sub-1 GHz Bands (600/700/850 MHz): Maximum coverage radius (10–30 km per sector), ideal for low-density rural areas. Throughput limited to 20–50 Mbps per subscriber with 10–20 MHz of spectrum. Best suited for basic broadband (browsing, streaming, VoIP).
    • Mid-Band (1.8/2.1/2.6 GHz): Balanced coverage (5–15 km) and capacity (30–100 Mbps per subscriber). The sweet spot for most rural deployments, offering sufficient throughput for HD streaming, video conferencing, and cloud applications.
    • C-Band / n77/n78 (3.3–4.2 GHz): Higher capacity (50–200+ Mbps) with reduced coverage (3–8 km). Suitable for rural towns and village centers where subscriber density supports the infrastructure investment.
    • CBRS (3.5 GHz, US-specific): The shared spectrum model enables rural ISPs and WISPs to deploy private LTE/5G networks without costly spectrum auctions. CBRS SAS (Spectrum Access System) management costs approximately $2–$5 per CPE per year.

    CPE Selection Criteria for Rural Deployments

    Rural FWA CPE devices must meet a distinct set of requirements compared to urban deployments. Key selection criteria include:

    • High-Gain Antenna Support: Rural CPE should support external antenna connections (TS-9 or SMA) for high-gain directional or panel antennas (8–14 dBi), enabling reliable connectivity at cell-edge distances of 15–30 km.
    • Outdoor-Rated Design: IP65 minimum; IP67 preferred for exposed installations. Operating temperature range of -20°C to +55°C to handle seasonal extremes.
    • Power over Ethernet (PoE): Simplifies installation by combining power and data over a single Ethernet cable, reducing the need for outdoor electrical work.
    • Carrier Aggregation: Support for at least 3CA (3-carrier aggregation) on 4G, and 100 MHz CA on 5G NR, to maximize throughput from available spectrum fragments.
    • Remote Management: TR-069 or TR-369 USP support for zero-touch provisioning, remote firmware updates, and performance monitoring — critical when truck rolls cost $50–$150 in rural areas.
    • Wi-Fi 6 Integrated AP: Built-in Wi-Fi 6 (802.11ax) access point with at least 2×2 MIMO ensures the CPE doubles as the subscriber’s home gateway, eliminating the need for a separate router.

    Case Study: WISP Achieves 14-Month Payback with 4G FWA in Rural Midwest USA

    A regional WISP serving three rural counties in the US Midwest deployed CBRS-based 4G LTE FWA using Cat 20 outdoor CPE devices to connect 1,200 subscribers across 12 tower sites in 2025. Key outcomes through mid-2026:

    • Total CAPEX: $420,000 ($35,000 per tower site, including CPE)
    • Average throughput delivered: 55 Mbps down / 15 Mbps up
    • Average ARPU: $45/month (residential) + $89/month (business)
    • Subscriber acquisition cost: $185 (CPE + installation)
    • Annual revenue (Year 1): $648,000
    • Annual OPEX (Year 1): $156,000
    • Payback period: 14 months
    • Churn rate: 8% annually (vs. 25%+ for GEO satellite competitors)

    The WISP is now expanding to 5G FWA in three higher-density rural towns using C-band spectrum, targeting 2,000 additional subscribers by end of 2027.

    Government Funding and Universal Service: Unlocking Rural FWA Investment

    A critical factor improving rural FWA economics in 2026 is the availability of government subsidy programs. Operators should actively pursue these funding sources to reduce upfront CAPEX and accelerate ROI:

    • US: FCC Rural Digital Opportunity Fund (RDOF): $20.4 billion allocated through 2030, with FWA-eligible census blocks receiving up to $2,000 per location.
    • EU: Connecting Europe Broadband Fund (CEBF): €2.5 billion for rural broadband, with FWA recognized as a qualifying technology under updated 2026 guidelines.
    • India: BharatNet Phase III: $8.5 billion allocated, with FWA explicitly included as a last-mile technology option for gram panchayats.
    • Africa: World Bank Digital Economy Initiative: $5 billion for sub-Saharan Africa broadband, with FWA and satellite-backhaul combinations prioritized for rural connectivity.
    • LATAM: IDB Connect 2026: $3.2 billion for rural digital inclusion across Latin America and the Caribbean.

    Conclusion: FWA CPE Is the Economic Engine of Rural Broadband

    The economics of rural broadband have fundamentally shifted. With 4G LTE Cat 20 CPE available at $90–$130 per unit, 5G Sub-6 GHz CPE at $100–$160, and tower infrastructure CAPEX declining as equipment vendors offer compact, integrated solutions, FWA now delivers the most compelling ROI of any rural last-mile technology.

    For ISPs and MNOs evaluating rural expansion strategies in 2026, the decision framework is clear: FWA CPE provides 12–24 month payback periods, operational flexibility, and the ability to scale capacity incrementally as demand grows. Combined with government universal service funding, rural FWA is not merely viable — it is one of the most attractive growth opportunities in the telecom sector today.

    For operators seeking CPE solutions optimized for rural FWA deployments — including outdoor-rated devices with high-gain antenna support, TR-369 remote management, and multi-band carrier aggregation — Honlly Telecom offers a comprehensive portfolio of 4G and 5G FWA CPE designed for challenging deployment environments.

  • How MVNOs and ISPs Can Build a Differentiated FWA Offering with White-Label 4G/5G CPE: A Go-to-Market Guide for 2026

    How MVNOs and ISPs Can Build a Differentiated FWA Offering with White-Label 4G/5G CPE: A Go-to-Market Guide for 2026

    In an increasingly competitive fixed wireless access (FWA) market, MVNOs and regional ISPs face a fundamental challenge: how to differentiate their broadband offering when the underlying network infrastructure is often shared with larger competitors. The answer, increasingly, lies in the CPE itself. A well-chosen white-label 4G or 5G CPE strategy can transform a commodity connectivity service into a branded, differentiated, and defensible product offering — without the capital investment required to build proprietary hardware. This guide outlines the strategic and operational framework for MVNOs and ISPs to build a differentiated FWA offering using white-label CPE in 2026.

    Why White-Label CPE Matters for MVNO and ISP Strategy

    The CPE sitting in a subscriber’s home or office is the only physical touchpoint between the service provider and the end customer. It is also the most visible brand asset. When an MVNO ships a generic, unbranded router to a subscriber, the brand experience is diluted, and the subscriber’s loyalty attaches to the network — not the service provider. White-label CPE changes this equation in several critical ways:

    • Brand presence: A custom-branded CPE with the MVNO or ISP logo, custom packaging, and branded web UI creates a consistent brand experience from unboxing to daily use. This is particularly valuable for ISPs competing against incumbent operators with strong consumer brand recognition.
    • Service differentiation: White-label CPE can be pre-configured with custom firmware features — branded captive portals, value-added services (parental controls, QoS profiles, IoT network segmentation), and operator-specific cloud management dashboards — that generic CPE cannot deliver.
    • Customer retention: Subscribers using a branded, customized CPE are less likely to churn because the device is visibly associated with the provider’s service. If a subscriber switches providers, the CPE becomes a visible reminder of what they left.
    • Revenue expansion: A white-label CPE platform enables upselling of managed Wi-Fi services, enhanced security packages, and premium support tiers — revenue streams that are impossible with generic off-the-shelf routers.

    Building the White-Label CPE Strategy: A Four-Phase Framework

    Phase 1: Define Your Differentiation Layer

    Before selecting a CPE partner, MVNOs and ISPs must define exactly how the CPE will contribute to competitive differentiation. There are four primary differentiation layers:

    1. Brand identity layer: Custom industrial design (enclosure color, form factor, logo placement), branded packaging, and customized web UI. This is the minimum viable white-label approach and can be implemented within 4-8 weeks with the right OEM partner.
    2. Software experience layer: Custom firmware builds that include operator-specific features: self-installation wizard, bandwidth usage dashboard, parental controls, guest network management, and integrated billing portal access. This requires deeper OEM collaboration but delivers the highest perceived value to subscribers.
    3. Network optimization layer: Operator-specific RF calibration, band-locking profiles, carrier aggregation optimization for the MNO’s specific spectrum holdings, and APN pre-configuration. This layer directly impacts service quality and subscriber satisfaction.
    4. Cloud management layer: White-label TR-069/TR-369 ACS platform or cloud controller that provides the operator with fleet-wide CPE management, remote diagnostics, bulk firmware updates, and performance analytics — all under the operator’s brand.

    Phase 2: Select the Right OEM/ODM CPE Partner

    Choosing a white-label CPE partner is a strategic decision that affects product quality, time-to-market, and long-term operational costs. B2B buyers should evaluate potential OEM/ODM partners across these criteria:

    • Platform flexibility: Can the partner support multiple chipset platforms (Qualcomm, MediaTek, UNISOC) across LTE and 5G NR? A multi-platform partner allows the operator to source the best silicon for each market segment without switching vendors.
    • Customization depth: What is the minimum order quantity (MOQ) for custom enclosures? Can the partner support custom firmware builds, custom packaging, and regional certification (FCC, CE, GCF, PTCRB)? How long is the customization lead time?
    • Software capability: Does the partner have an in-house software engineering team that can develop custom features, integrate with the operator’s OSS/BSS, and provide ongoing firmware maintenance? Open-source CPE stacks (OpenWrt, prplOS, RDK-B) offer greater long-term flexibility than proprietary firmware.
    • Quality and reliability: Request field failure rate data, MTBF specifications, and manufacturing quality certifications (ISO 9001, ISO 14001). A CPE with a 2% annual field failure rate versus 5% represents a significant difference in truck-roll cost and subscriber churn over a 3-year deployment.
    • Logistics and fulfilment: Can the partner support drop-shipping directly to subscribers? What are the warehousing and inventory management options? Regional warehousing can reduce lead times from 6-8 weeks to 3-5 days for large operators.

    Phase 3: Develop the Service Wrapper

    The CPE is hardware; the differentiated offering is the complete service wrapper around it. MVNOs and ISPs should design these service elements in parallel with CPE selection:

    • Self-installation experience: A guided mobile app or web-based setup wizard that reduces installation truck rolls. Data from operators shows that self-installation rates of 70-85% are achievable with well-designed CPE onboarding, reducing per-subscriber acquisition cost by $80-150.
    • Tiered service plans: Use the CPE’s software capabilities to enforce bandwidth tiers, data caps, and QoS profiles that map to differentiated price points. A single CPE hardware SKU can serve multiple subscription tiers through software configuration alone.
    • Managed Wi-Fi add-on: Offer subscribers a premium managed Wi-Fi service (optimized channel selection, band steering, mesh extension) as a monthly upsell. This typically adds $3-7/month ARPU with near-zero incremental hardware cost on capable CPE platforms.
    • Business-grade SLAs: For enterprise and SMB subscribers, offer enhanced support SLAs, static IP options, VPN endpoint configuration, and priority network access — all manageable through the CPE’s cloud management platform.

    Phase 4: Launch, Measure, and Iterate

    A white-label CPE deployment is not a one-time project. Successful operators treat the CPE as a continuously evolving platform:

    • Subscriber analytics: Use telemetry from the CPE fleet to understand usage patterns, identify churn risk signals (declining signal quality, frequent reboots), and optimize network capacity planning.
    • Firmware iteration: Release quarterly firmware updates that add features, improve stability, and address security vulnerabilities. A CPE that improves over time generates positive word-of-mouth and reduces churn.
    • A/B testing: Use the CPE fleet to A/B test different QoS configurations, Wi-Fi channel strategies, and user interface designs to continuously optimize subscriber experience.
    • Expansion roadmap: Plan for the next CPE generation 12-18 months in advance. The transition from LTE to 5G, or from Wi-Fi 5 to Wi-Fi 6/6E/7, should be on the roadmap from day one with a clear hardware refresh strategy.

    The Business Case: White-Label CPE ROI

    For MVNOs and ISPs evaluating the business case, the ROI of white-label CPE can be quantified across three dimensions:

    • Churn reduction: Operators with branded CPE and custom firmware report 15-25% lower annual churn rates compared to those using generic CPE. For an ISP with 50,000 subscribers and an average acquisition cost of $200 per subscriber, a 5-percentage-point churn reduction represents approximately $5 million in annual savings.
    • ARPU uplift: Managed Wi-Fi and enhanced support tiers enabled by white-label CPE platforms typically add $3-7/month in incremental ARPU. At 50,000 subscribers with 30% adoption, this translates to $540,000-$1.26 million in annual recurring revenue.
    • Brand equity: While harder to quantify, branded CPE builds long-term brand recognition and trust that supports premium pricing, partnership leverage, and market expansion. In competitive markets, this can be the difference between a sustainable MVNO and one that competes solely on price.

    Honlly Telecom’s White-Label CPE Partnership Program

    Honlly Telecom provides comprehensive OEM/ODM white-label CPE solutions for MVNOs, ISPs, and telecom operators globally. Our partnership program includes:

    • Custom industrial design and enclosure branding with MOQs as low as 500 units
    • Custom firmware development on OpenWrt and RDK-B platforms with operator-specific feature integration
    • Regional certification support (FCC, CE, GCF, PTCRB, Anatel, NCC, and others)
    • Custom packaging, quick-start guides, and branded web UI in the operator’s language and design language
    • Cloud management platform integration with TR-069/TR-369 support
    • Flexible logistics: factory-direct shipping, regional warehousing, or drop-ship to end subscribers
    • Product portfolio spanning 4G Cat 4/6/12/20 CPE, 5G NR Sub-6 GHz and mmWave CPE, indoor and outdoor form factors, and industrial-grade routers

    To explore a white-label CPE partnership with Honlly Telecom, contact our B2B OEM/ODM team for a consultation and product roadmap discussion.

  • 4G LTE Cat 6 vs Cat 12 vs Cat 20 CPE: A Practical B2B Buyer’s Guide to Choosing the Right LTE Category for ISP and Enterprise Deployments

    4G LTE Cat 6 vs Cat 12 vs Cat 20 CPE: A Practical B2B Buyer’s Guide to Choosing the Right LTE Category for ISP and Enterprise Deployments

    For ISPs, MVNOs, and enterprise buyers deploying LTE-based fixed wireless access or backup connectivity, the choice between 4G LTE Cat 6, Cat 12, and Cat 20 CPE is one of the most consequential procurement decisions. While 5G dominates industry headlines, 4G LTE remains the workhorse of global wireless broadband — particularly in markets where 5G coverage is still expanding, spectrum costs are constrained, or deployment economics favor LTE. This guide provides a practical, technically grounded comparison to help B2B buyers select the right LTE category for their specific deployment requirements.

    Understanding LTE UE Categories: What the Numbers Mean

    LTE User Equipment (UE) categories are defined by 3GPP and specify the maximum theoretical downlink and uplink data rates a device can achieve. The category number is not a marketing label — it directly corresponds to specific technical capabilities including carrier aggregation (CA) configuration, MIMO layers, and modulation scheme:

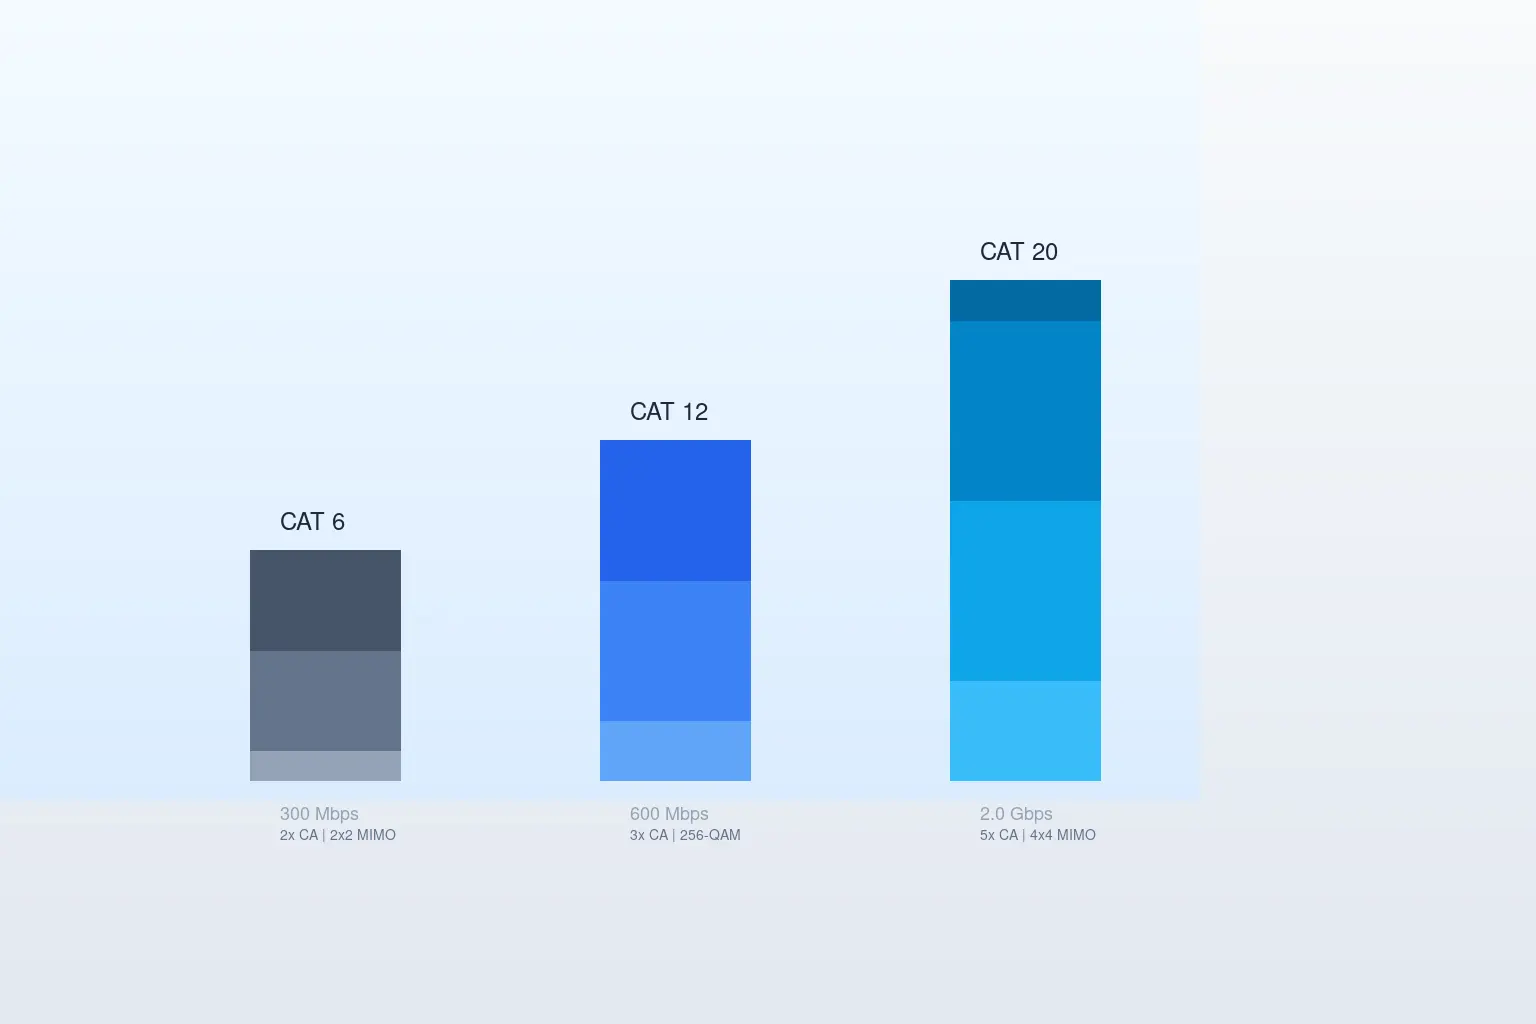
    Parameter Cat 6 Cat 12 Cat 20
    Max Downlink 300 Mbps 600 Mbps 2.0 Gbps
    Max Uplink 50 Mbps 150 Mbps 316 Mbps
    Carrier Aggregation 2× CA (20+20 MHz) 3× CA 5× CA
    MIMO Layers (DL) 2×2 2×2 or 4×4 4×4
    Modulation (DL) 64-QAM 256-QAM 256-QAM
    3GPP Release Rel 10/11 Rel 12 Rel 13/14
    Typical Real-World DL 80–180 Mbps 150–350 Mbps 300–800 Mbps

    Key takeaway: The jump from Cat 6 to Cat 12 is primarily about adding 256-QAM modulation and a third carrier, roughly doubling real-world throughput. The jump from Cat 12 to Cat 20 adds 4×4 MIMO and up to 5-carrier aggregation, enabling near-gigabit LTE performance — but requires significantly more spectrum availability at the tower side.

    Cat 6 CPE: The Cost-Effective Workhorse

    Best For

    • Rural and suburban FWA where spectrum aggregation is limited to two carriers
    • SMB backup internet and failover (typically paired with wired primary WAN)
    • IoT gateway and telemetry aggregation (low bandwidth, high device count)
    • Price-sensitive ISP deployments in emerging markets
    • Fixed-location retail POS and ATM connectivity

    Advantages

    • Lowest BOM cost: Cat 6 CPE modules and chipsets are the most mature and widely available, with module pricing typically 40-60% below Cat 12 equivalents.
    • Widest operator compatibility: Virtually every LTE network worldwide supports 2× carrier aggregation, making Cat 6 the most universally deployable category.
    • Lower power consumption: Typical Cat 6 CPE draws 5-8W under load, making it suitable for solar-powered or battery-backed remote deployments.
    • Proven reliability: Cat 6 has been in volume deployment for over 8 years; firmware and interoperability issues are well-understood and resolved.

    Limitations

    • Real-world throughput of 80-180 Mbps is insufficient for multi-user HD streaming or large file transfers in office environments.
    • 50 Mbps uplink ceiling limits cloud backup, video conferencing upload quality, and symmetrical enterprise applications.
    • Only 2×2 MIMO means weaker signal resilience at cell edge compared to 4×4 configurations.

    Cat 12 CPE: The Balanced Mid-Tier Performer

    Best For

    • Suburban and peri-urban FWA where operators have deployed 3-carrier aggregation
    • SME primary internet (10-50 users) where fiber is unavailable or uneconomical
    • Enterprise branch office primary or load-balanced WAN
    • Multi-tenant residential CPE (MDUs, student housing)
    • Operator-branded home broadband routers for markets with moderate spectrum depth

    Advantages

    • 256-QAM modulation delivers 33% more bits per symbol than Cat 6’s 64-QAM, significantly improving spectral efficiency.
    • 3× carrier aggregation allows the CPE to combine three separate LTE carriers, increasing aggregate bandwidth and improving load balancing across spectrum bands.
    • Optional 4×4 MIMO on some Cat 12 implementations provides better signal quality and throughput at medium-to-long range from the tower.
    • Solid uplink: 150 Mbps theoretical uplink (typically 40-80 Mbps real-world) supports cloud applications, video conferencing, and remote work use cases.

    Limitations

    • Performance is highly dependent on operator spectrum holdings — a Cat 12 CPE on a network with only 2 carriers will perform similarly to Cat 6.
    • Module and CPE BOM cost is 30-50% higher than Cat 6, which matters at ISP deployment scale.
    • Not all Cat 12 implementations include 4×4 MIMO; buyers must verify antenna configuration in the specific CPE model.

    Cat 20 CPE: Maximum LTE Performance for Demanding Deployments

    Best For

    • Enterprise headquarters and large branch offices (50+ users) requiring high-capacity wireless WAN
    • Operator FWA deployments in spectrum-rich markets (5+ carrier LTE networks)
    • Temporary event connectivity and rapid-deployment enterprise networks
    • High-definition video backhaul and surveillance aggregation
    • Markets where 5G NR coverage is not yet available but gigabit-class throughput is required

    Advantages

    • Gigabit-class LTE: With 5× carrier aggregation, 4×4 MIMO, and 256-QAM, Cat 20 can deliver 300-800 Mbps real-world downlink — competitive with entry-level 5G in many deployments.
    • 4×4 MIMO as standard: All Cat 20 devices support 4×4 MIMO on at least two carriers, providing superior signal resilience, cell-edge performance, and spatial multiplexing gain.
    • Highest uplink in LTE: 316 Mbps theoretical uplink (typically 80-150 Mbps real-world) supports symmetrical enterprise applications, cloud backup, and multi-user video conferencing.
    • Enhanced interference management: Cat 20’s 256-QAM with advanced receiver algorithms provides better throughput maintenance in high-interference urban environments.

    Limitations

    • Highest cost: Cat 20 modules can cost 2-3× more than Cat 6 equivalents, and CPE BOM costs are proportionally higher due to additional RF paths, antennas, and processing requirements.
    • Spectrum-dependent: A Cat 20 CPE deployed on a network with only 2-3 carriers will not achieve its rated performance. Operators must have 5+ carriers available at the serving cell.
    • Higher power: Typical power draw of 10-15W under load requires consideration for thermal management and installation location.

    Decision Framework: How to Choose

    Rather than selecting based on category number alone, B2B buyers should evaluate their deployment against these five criteria:

    1. Operator spectrum profile: Request the operator’s carrier aggregation configuration at the target deployment site. A Cat 20 CPE on a 2-carrier network is wasted investment; a Cat 6 CPE on a 5-carrier network leaves significant capacity unused.
    2. User count and application profile: For 1-5 users doing web/email (30 Mbps actual needed), Cat 6 suffices. For 10-30 users with video conferencing and cloud apps (100-200 Mbps), Cat 12 is the sweet spot. For 50+ users or HD video backhaul (300+ Mbps), choose Cat 20.
    3. Uplink requirements: If your deployment involves cloud backup, surveillance upload, or symmetrical applications, pay close attention to uplink specifications. The 50 Mbps Cat 6 uplink ceiling can be a bottleneck even when downlink is adequate.
    4. Deployment lifespan: A CPE purchased today for a 5-year deployment should account for growing bandwidth demand. Many ISPs are finding that Cat 6 deployments from 2021-2022 are now bandwidth-constrained; Cat 12 or Cat 20 provides more headroom for 2026-2031.
    5. Total cost of ownership (TCO): Include not just the CPE unit cost but also installation complexity (more antennas for Cat 20), power consumption, and potential truck-roll costs for mid-life upgrades. For large-scale ISP deployments, the Cat 6-to-Cat 12 TCO differential can influence per-subscriber margin by 8-15%.

    Honlly Telecom’s LTE CPE Portfolio

    Honlly Telecom offers OEM/ODM LTE CPE solutions across Cat 4, Cat 6, Cat 12, and Cat 20 categories, with flexible band configurations tailored to regional operator requirements. Our B2B customers can select from indoor desktop CPE, outdoor CPE with IP67 enclosure, and industrial-grade routers with extended temperature ranges. All platforms support cloud-based TR-069/TR-369 remote management and can be white-labeled with custom branding, firmware, and packaging.

    Contact the Honlly Telecom B2B sales team to discuss your LTE CPE deployment requirements and request evaluation samples.